

The Most-Tested Topics in IGCSE Maths (CIE 0580)
Every 0580 past-paper question, tagged to its syllabus topic — ranked by how often each is tested (2020–2025).
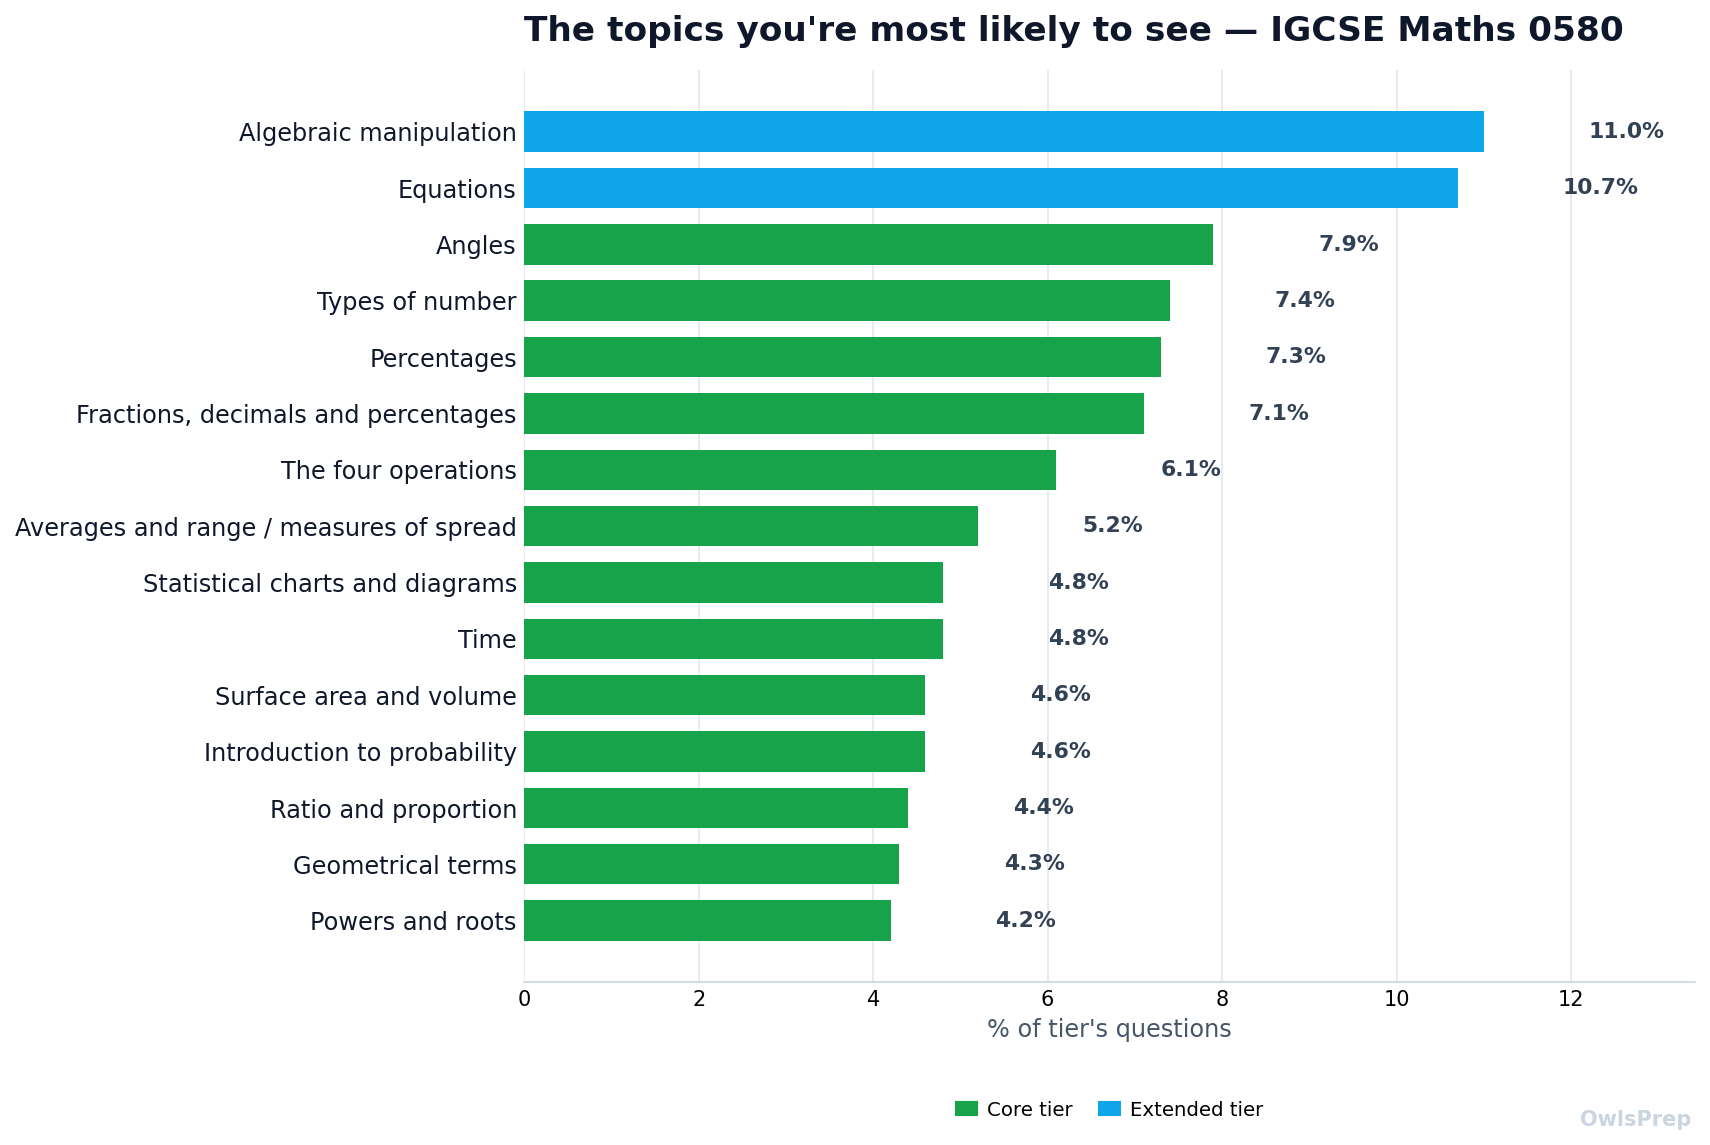
Core tier (Papers 1 / 3)
80 papers analysed · top 15 of 54 topics
| # | Topic | % of tier's questions | Questions | Avg marks |
|---|---|---|---|---|
| 1 | Equations | 7.9% | 111 | 6.2 |
| 2 | Angles | 7.9% | 111 | 5.7 |
| 3 | Types of number | 7.4% | 104 | 5 |
| 4 | Percentages | 7.3% | 102 | 8 |
| 5 | Fractions, decimals and percentages | 7.1% | 100 | 5.2 |
| 6 | Algebraic manipulation | 6.6% | 92 | 5.2 |
| 7 | The four operations | 6.1% | 85 | 6.1 |
| 8 | Averages and range / measures of spread | 5.2% | 73 | 5.8 |
| 9 | Time | 4.8% | 68 | 7 |
| 10 | Statistical charts and diagrams | 4.8% | 68 | 7.3 |
| 11 | Introduction to probability | 4.6% | 65 | 6.2 |
| 12 | Surface area and volume | 4.6% | 64 | 6.4 |
| 13 | Ratio and proportion | 4.4% | 62 | 8.3 |
| 14 | Geometrical terms | 4.3% | 60 | 6.8 |
| 15 | Powers and roots | 4.2% | 59 | 5.7 |
Extended tier (Papers 2 / 4)
80 papers analysed · top 15 of 71 topics
| # | Topic | % of tier's questions | Questions | Avg marks |
|---|---|---|---|---|
| 1 | Algebraic manipulation | 11% | 159 | 6.9 |
| 2 | Equations | 10.7% | 154 | 8.1 |
| 3 | Percentages | 5.1% | 74 | 8.9 |
| 4 | Surface area and volume | 4.6% | 66 | 8.5 |
| 5 | Angles | 4.6% | 66 | 4 |
| 6 | Averages and range / measures of spread | 4.1% | 59 | 8.2 |
| 7 | Fractions, decimals and percentages | 3.9% | 57 | 3.2 |
| 8 | Non-right-angled triangles | 3.4% | 49 | 10.3 |
| 9 | Indices II | 3.3% | 47 | 7 |
| 10 | Circles, arcs and sectors | 3.3% | 47 | 9 |
| 11 | Probability of combined events | 3.2% | 46 | 8.5 |
| 12 | Exponential growth and decay | 3% | 43 | 9 |
| 13 | Right-angled triangles | 3% | 43 | 10.3 |
| 14 | Differentiation | 2.9% | 42 | 10.3 |
| 15 | Similarity | 2.9% | 42 | 6.8 |
How this was measured
Based on OwlsPrep's database of official CIE 0580 past papers (2020–2025), 2848 questions each tagged to its syllabus topic. Topics are grouped by paper tier; “% of tier's questions” = the share of that tier's tagged questions testing the topic. Because one question can test several topics, shares do not sum to 100%. Figures are aggregate statistics from question metadata — no exam questions or mark schemes are reproduced.
You've seen what's most tested. Now master it.
Photograph any 0580 past-paper question and get the full working — step by step, checked against the mark scheme — not just the final answer.
Solve a question free →